Sales and discounts
What you take in each month and what your discounts cost you.
Analytics
See how much you sell, what sells, what each channel costs you and how your deliveries are going, by date, by brand or by location. No spreadsheets needed.
€6M+
processed
+400k
orders

Everything that goes through your online store, at the table and at the kiosk, in charts you can understand at a glance.

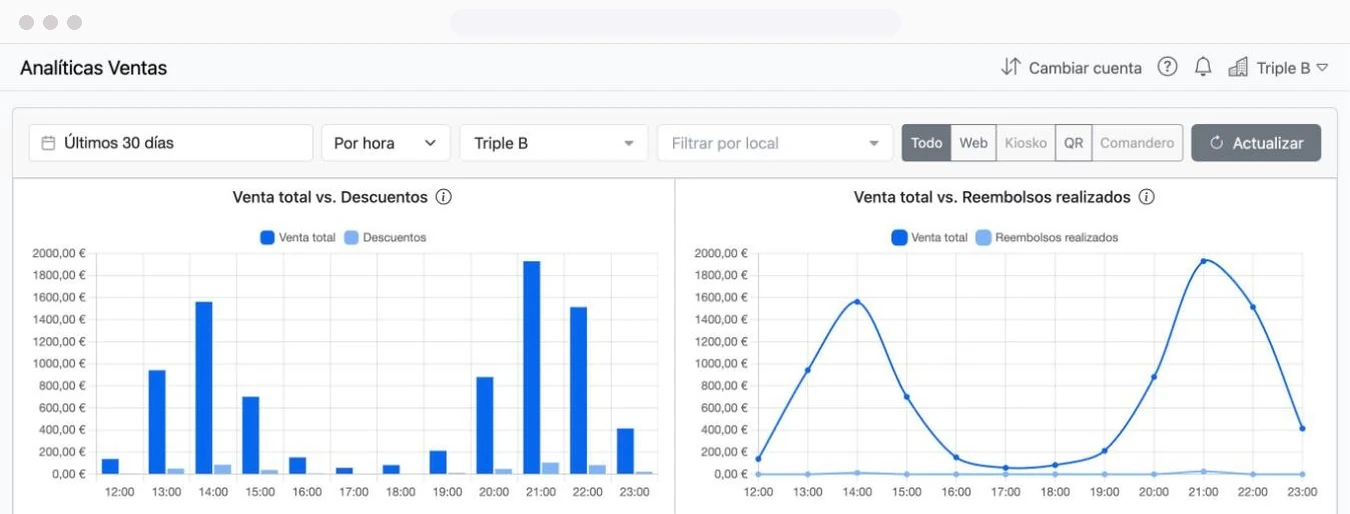
What you take in each month and what your discounts cost you.
Overall, delivery, takeaway and by payment method.
How many orders and how much in sales come from delivery, takeaway and table.
Which part is paid online and which part at the restaurant.
What you refund compared to what you charge online.
How your numbers change month to month, or week to week.
From the whole brand at a glance to a single location at a specific hour.
For any dates you want
Grouped by hour, day, week or month
By brand or by location
With the same filters for your deliveries
To decide your menu, your promotions and your purchasing based on data.

Sort them by units sold or by revenue, at each location.
Units sold and revenue for each product, day by day.
Which attributes your customers choose with each product.
With data from all your fleets and your riders together.

Delivered, canceled, in progress and failed.
From your store, created manually or from external platforms.
Total cost and average cost per delivery.
The minutes of difference between delivery and the promised time, and between kitchen and pickup.
Choose the period, the brand and the locations, and get in a single report what you've sold, what it cost you and what you would have paid on the platforms for those same orders.
What your store costs you vs. the platforms, with the percentage you set
Delivery and takeaway orders, amounts collected, discounts and refunds
What's been transferred to your account and what's pending
Your transaction and delivery costs
Export your orders and deliveries to CSV whenever you want. And cross-check the numbers with your CRM: behind every order is a customer with a name, history and club level.
Each customer's profile, with all their orders.
Your orders and your deliveries, to take wherever you want.
Analytics comes included in Pro and Advance.
Included
on the Pro and Advance plans
Sales, products and deliveries
Filters by date, brand and location
Orders and deliveries exportable to CSV
What can I filter?
Any dates you want, grouped by hour, day, week or month, and by brand or location. If you don't filter, you see data for the whole brand together.
Can I see each location separately?
Yes. Filter by location to see its sales, products and deliveries, or compare the whole brand.
Can I see what each product sells?
Yes. You get the product ranking, sortable by units sold or by revenue, and the details of each one: when it sells and which extras or options are ordered with it.
How do I know what my channel costs me compared to the platforms?
The report by period compares what your store costs you with what you'd pay on the platforms for those same orders. You set the platforms' percentage.
Can I export the data?
Yes, your orders and your deliveries in CSV. The charts are viewed in the dashboard.
Which plans include analytics?
On all of them: it's included in Pro and Advance.
Free assessment
We look at your numbers by channel and help you see what each order really costs you and where you earn the most.
What each order costs you on each platform
Which products, hours and areas leave you the most margin
What data you'd see in your dashboard from day one
Free





Pau, Dani, Her, Jesús and Genesis
Delitbee sales team
What you get
A reading of your numbers by channel and the first steps to improve your margin
How long it takes
10-15 minutes
Cost
Free and no strings attached